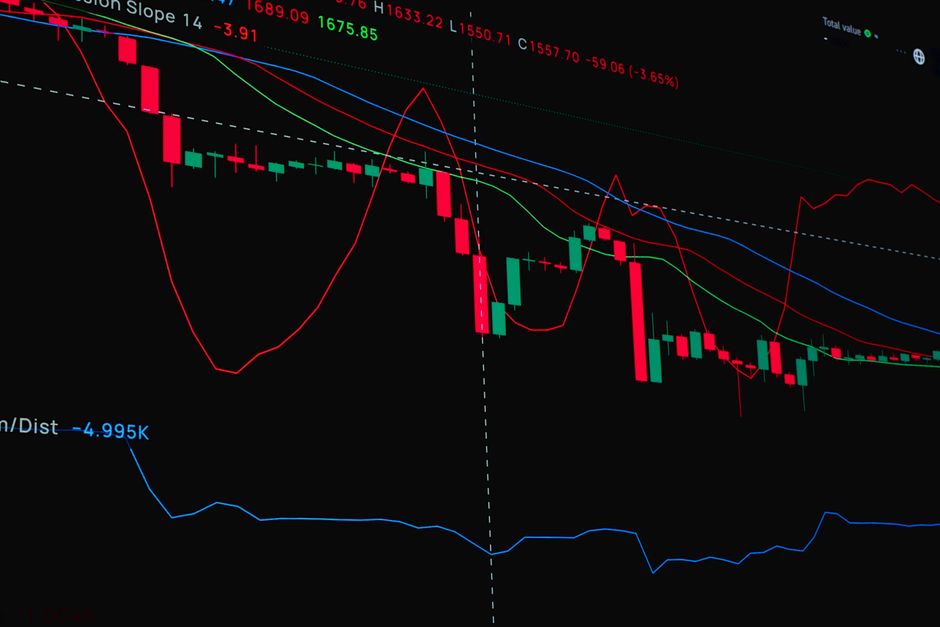
Investing.com’s technical analysis notes that silver closed around $67.34 after a sharp rebound from the September 1 low of $63.88. The 15‑minute chart places price above the daily VC PMI mean of $65.15 and the Daily Sell 1 level at $66.49, indicating a bullish short‑term momentum configuration, though the metal is now testing Daily Sell 2 resistance at $67.53.
The analysis suggests that a sustained close above $67.53 would strengthen the breakout and could expose the weekly VC PMI mean at $68.89, followed by the Weekly Sell 1 level at $70.95. Conversely, failure to hold $66.49 might signal weakening momentum and could prompt a move toward $65.73, identified as the Weekly Buy 1 level.
Key support zones identified include Daily Buy 1 at $64.11, Weekly Buy 2 at $63.67 and Daily Buy 2 at $62.77. A break below $63.67 would erode the recovery and reopen the lower support cluster. The MACD indicator remains positive, but the analysis stresses that confirmation requires continued closes above resistance with expanding volume.
Cycle analysis highlights September 1‑3 as an important reversal window, consistent with the recent recovery. Upcoming timing windows to watch are September 7‑9, September 14‑16 and September 28, which could signal changes in trend or volatility. The Square of 9 method reinforces $67.50‑$68.00 as immediate rotational resistance, with upside objectives at $68.90 and $70.95, while downside support clusters around $65.15, $64.11 and $63.67.
Fundamentally, the report notes that silver remains sensitive to Federal Reserve expectations, real interest rates, the U.S. dollar, industrial demand, investment flows and geopolitical risk. Strong demand from solar, electronics and electrification sectors supports the longer‑term case, whereas a stronger dollar or higher real yields could increase volatility.
The analysis includes a standard disclaimer that the report is educational, not investment advice, and that futures involve substantial risk.